How to Monitor IoT Gateway Performance and Availability Effectively?
In my years managing large-scale industrial network deployments, I have observed that the gateway is often the most neglected yet critical component of the architecture. It serves as the bridge between localized sensors and cloud-based analytics. When a gateway fails or underperforms, your entire data visibility vanishes. Consequently, understanding how to monitor iot gateway performance and availability is not just a technical requirement; it is a business necessity for maintaining operational continuity. Many teams wait for a system crash before investigating, but proactive monitoring can identify bottlenecks before they lead to expensive downtime. This guide will detail the technical metrics and strategies required to maintain a healthy edge infrastructure.
Establishing Key Performance Indicators (KPIs) for IoT Gateways
To effectively manage an edge device, you must identify what “good” performance looks like. I recommend focusing on resource utilization and data throughput as your primary metrics. If the hardware is overtaxed, data latency will inevitably increase, leading to desynchronization in real-time processes.
Resource Utilization Tracking
Monitoring the CPU and RAM usage of your gateway is the first line of defense against performance degradation. Most industrial gateways run on Linux-based systems where you can utilize agents to report system health. Consistently tracking CPU spikes helps identify inefficient local processing or potential security intrusions. If memory usage grows steadily without returning to a baseline, you are likely facing a memory leak in your edge software.
Latency and Data Throughput Analysis
You should measure the time it takes for a data packet to travel from the sensor, through the gateway, to the management platform. According to ISO/IEC 30141 standards for IoT Reference Architecture, system responsiveness is a core quality attribute. Monitoring packet loss and round-trip time (RTT) ensures that your network infrastructure can handle the volume of sensor traffic. High latency often indicates network congestion or a failing backhaul connection.
Implementing Robust Availability Monitoring Strategies
Availability refers to the “up-time” of the device. In an industrial setting, a gateway that is online but unable to pass traffic is effectively unavailable. I have found that simple “pings” are insufficient for professional monitoring.
Heartbeat Signals and Keep-Alive Protocols
A heartbeat signal is a small, periodic message sent by the gateway to the cloud server to confirm it is still functional. Utilizing MQTT or WebSockets for these signals allows for near-real-time visibility. Implementing redundant heartbeat signals ensures that you are alerted within seconds of a gateway disconnection. This allows your maintenance team to react before the loss of data affects downstream operations.
SNMP and Local Hardware Health Monitoring
Simple Network Management Protocol (SNMP) remains a standard for professional network management. By using SNMP traps, the gateway can actively push alerts about hardware events, such as a power supply failure or an overheating chassis. Utilizing SNMP monitoring provides a standardized way to integrate IoT gateways into existing IT management dashboards. This alignment between IT and OT (Operational Technology) is a hallmark of successful digital transformation.
Advanced Diagnostic Techniques for Industrial Environments
Industrial environments present unique challenges, such as electromagnetic interference and extreme temperatures. Your monitoring strategy must account for these environmental factors to truly understand device health.
Environmental Sensor Integration
Advanced industrial gateways often include internal temperature and humidity sensors. Monitoring these metrics can prevent hardware failure caused by enclosure overheating. Correlating environmental data with performance drops allows you to identify if the gateway requires better thermal management or physical shielding. This prevents the “silent” hardware degradation that leads to intermittent connectivity issues.
Remote Log Aggregation and Edge Analytics
When a gateway experiences an intermittent fault, logs are your most valuable diagnostic tool. I suggest using a centralized log management system to aggregate error messages from all edge devices. Analyzing aggregated logs across multiple gateways helps identify systemic firmware bugs or regional network outages. Edge analytics can also be used to filter “noise” from the logs, ensuring that only critical alerts reach your engineering team.
Ensuring Network Resilience Through Strategic Hardware Selection
Knowing how to monitor iot gateway performance and availability is only half the battle; you also need a network that facilitates this monitoring. If the underlying network switches or media converters fail, your monitoring data will never reach the dashboard. I always judge the suitability of a monitoring system by the reliability of the transport layer.
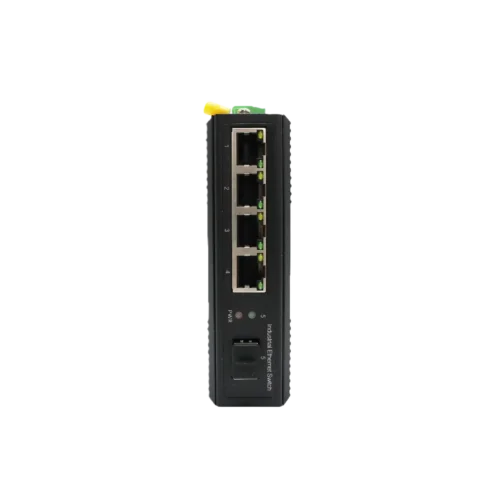
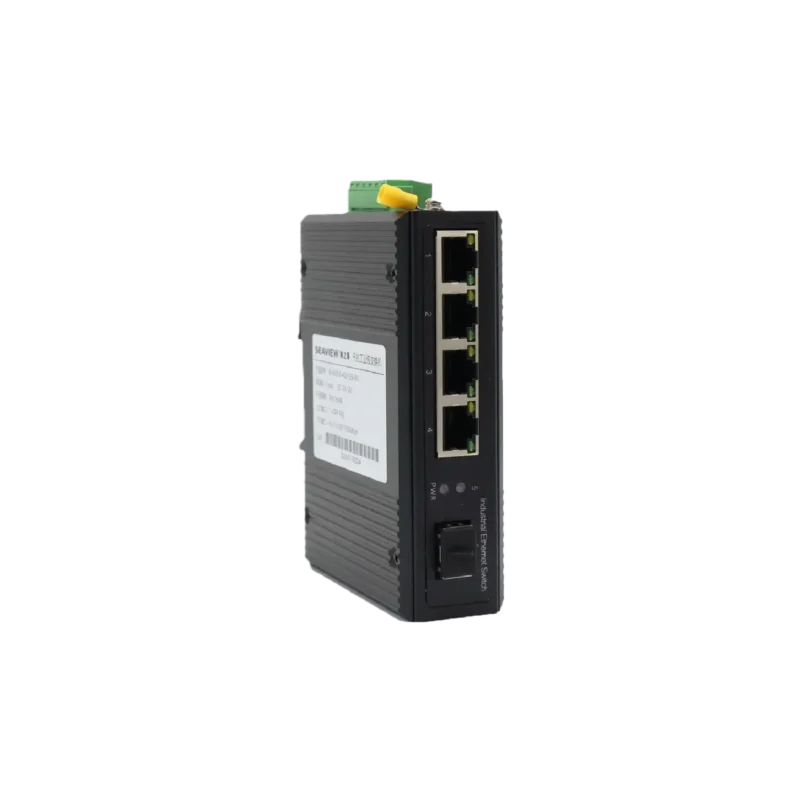
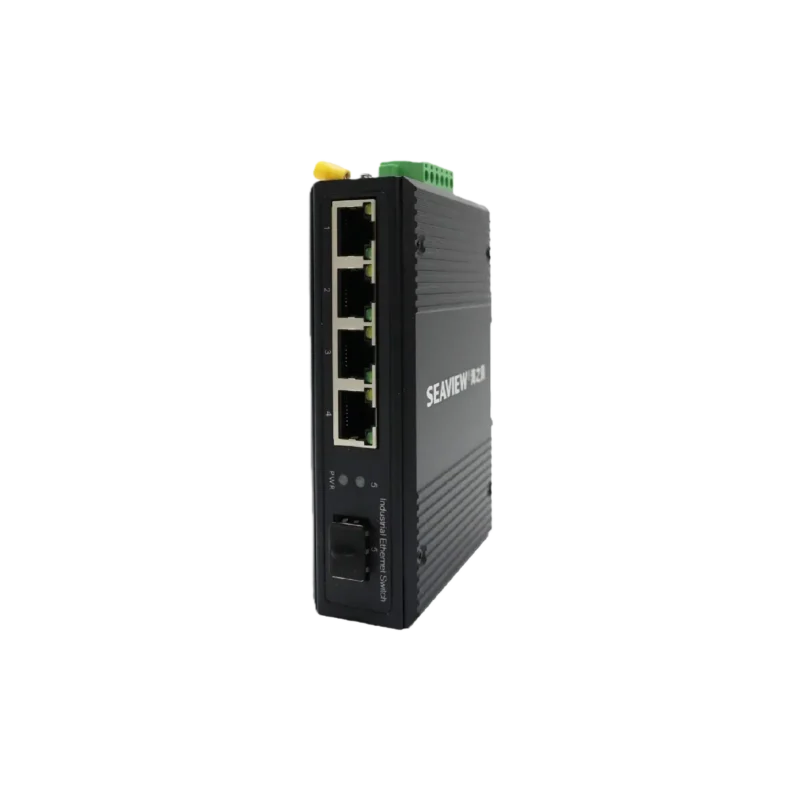
For environments requiring high uptime, selecting the right infrastructure is vital. I recommend exploring industrial grade switches to ensure that your gateway always has a stable physical connection to the rest of the facility. These switches are built to withstand the same harsh conditions as your gateways. Choosing industrial-standard switching hardware reduces the risk of monitoring gaps caused by localized power surges or vibration.
If your deployment spans long distances, the transport medium becomes a factor. A Gigabit industrial 1 fiber 4 copper media converter is an excellent tool for extending your monitoring reach while maintaining high-speed throughput. Utilizing fiber-optic backhauls protects your monitoring signals from the electrical noise commonly found in manufacturing plants.
Conclusion
The conclusion is that effective IoT gateway management requires a multi-layered approach focusing on real-time resource tracking and redundant availability protocols. To ensure long-term success, you must prioritize monitoring both the logical performance of the device and the physical health of the underlying network infrastructure. By following these professional standards, you can build a resilient IoT ecosystem that delivers consistent value and minimizes operational risks.
FAQ
1. What are the most important metrics for IoT gateway performance?
The most critical metrics are CPU usage, memory utilization, network latency, and packet loss. Tracking these KPIs allows you to identify if the gateway hardware is the bottleneck in your data pipeline.
2. How often should I check the availability of my gateway?
For mission-critical industrial applications, I recommend a heartbeat interval of 30 to 60 seconds. High-frequency availability monitoring ensures that you can trigger automated failover procedures almost immediately after a failure.
3. Can I monitor gateways that are in remote locations with poor connectivity?
Yes, you should use “lightweight” protocols like MQTT with a “Last Will and Testament” (LWT) feature. This feature allows the server to detect a disconnection even if the gateway cannot send a final “goodbye” message. Selecting communication protocols designed for low-bandwidth environments is essential for remote gateway monitoring.
4. Why is SNMP still used for IoT gateway monitoring?
SNMP is a mature, standardized protocol supported by almost all professional networking gear. Utilizing SNMP allows you to manage IoT gateways using the same tools used for your enterprise routers and switches.
5. How does a media converter help with monitoring?
A media converter allows you to use fiber optics for long-distance monitoring, which is immune to the electromagnetic interference found on factory floors. Using media converters ensures that your performance data is not corrupted by high-voltage machinery.
Reference Sources
NIST SP 800-213 – IoT Device Cybersecurity and Monitoring Guidance
IEEE 2413 – Standard for an Architectural Framework for the Internet of Things
IETF RFC 3411 – Architecture for Describing Simple Network Management Protocol (SNMP) Frameworks